Page 76 - CA Sri Lanka Integrated Annual Report 2023
P. 76

FINANCIAL REVIEW


          FINANCE INCOME
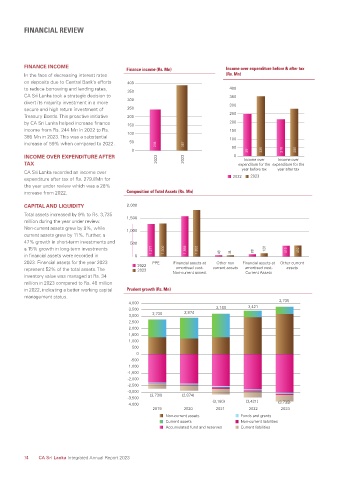
                                             Finance income (Rs. Mn)            Income over expenditure before & after tax
          In the face of decreasing interest rates                              (Rs. Mn)
          on deposits due to Central Bank’s efforts   400
          to reduce borrowing and lending rates,   350                            400
          CA Sri Lanka took a strategic decision to                               350
          divert its majority investment in a more   300                          300
          secure and high return investment of   250
          Treasury Bonds. This proactive initiative   200                         250
          by CA Sri Lanka helped increase finance   150                           200
          income from Rs. 244 Mn in 2022 to Rs.   100                             150
          386 Mn in 2023. This was a substantial                                  100
          increase of 59% when compared to 2022.    50  244       387
                                               0                                  50    251  335    218  280
          INCOME OVER EXPENDITURE AFTER                 2022      2023             0   Income over   Income over
          TAX                                                                        expenditure for the  expenditure for the
                                                                                      year before tax  year after tax
          CA Sri Lanka recorded an income over
          expenditure after tax of Rs. 279.8Mn for                                 2022  2023
          the year under review which was a 28%
          increase from 2022.                Composition of Total Assets (Rs. Mn)
          CAPITAL AND LIQUIDITY               2,000
          Total assets increased by 9% to Rs. 3,735   1,500
          million during the year under review.
          Non-current assets grew by 9%, while   1,000
          current assets grew by 11%. Further, a
          47% growth in short-term investments and   500
          a 15% growth in long-term investments       1,277  918  1,300  1,589  603  1,832  853  88  913  128  419  1,018  432
          in financial assets were recorded in   0                            48  44
          2023. Financial assets for the year 2023   2022  PPE  Financial assets at   Other non   Financial assets at   Other current
                                                               amortised cost-
          represent 52% of the total assets. The   2023       Non-current assest  current assets  amortised cost-   assets
                                                                                       Current Assets
          inventory value was managed at Rs. 34
          million in 2023 compared to Rs. 48 million
          in 2022, indicating a better working capital   Prudent growth (Rs. Mn)
          management status.
                                              4,000                                                3,735
                                              3,500               2,874      3,180      3,421
                                              3,000    2,730
                                              2,500
                                              2,000
                                              1,500
                                              1,000
                                               500
                                                 0 0
                                               -500
                                              -1,000
                                              -1,500
                                              -2,000
                                              -2,500
                                              -3,000
                                              -3,500  (2,730)    (2,874)
                                              -4,000                        (3,180)    (3,421)     (3,735)
                                                       2019       2020       2021       2022        2023
                                                           Non-current assets         Funds and grants
                                                           Current assets             Non-current liabilities
                                                           Accumulated fund and reserves  Current liabilities


          74   CA Sri Lanka Integrated Annual Report 2023
   71   72   73   74   75   76   77   78   79   80   81